Psychological Test – Vienna Test Systems
A modern and sophisticated method of computerized phychological testing
Read more
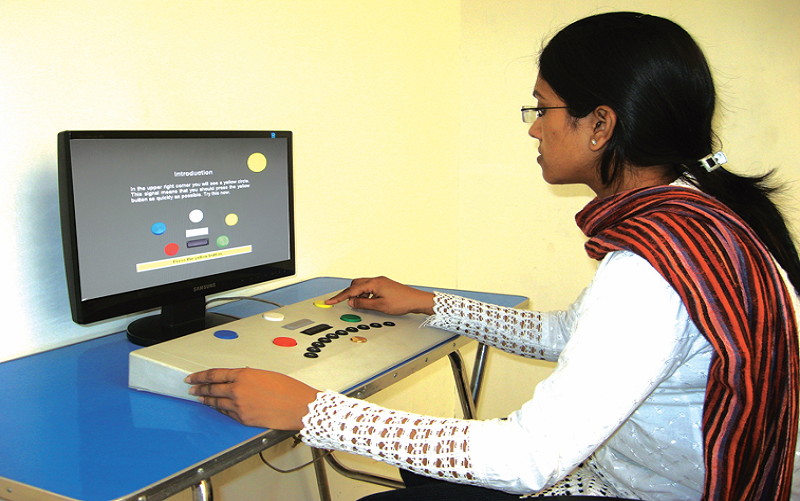
The administration of each test is standardised. Tests can be batched together in test batteries and automatically administered with the same ‘look and feel’.All of the tests available on the VTS have been developed according to modern test theory and contemporary scoring methods guarantee testing precision and test fairness.It is a safety driving courses in India of paramount importance.The basic software is the administration, scoring and data-based platform for all the VTS tests. This software provides the tools to work with all test takers results, customise tests, and generally adapt the testing system to the individual needs. An easy to use software interface makes working with the VTS simple intuitive and efficient. Participant’s results are presented as tables, charts or graphs. Test variables are displayed together with the raw scores and the corresponding norms. These norm value comparisons refer either to an overall sample, created according to criteria related to age, gender, education, among others.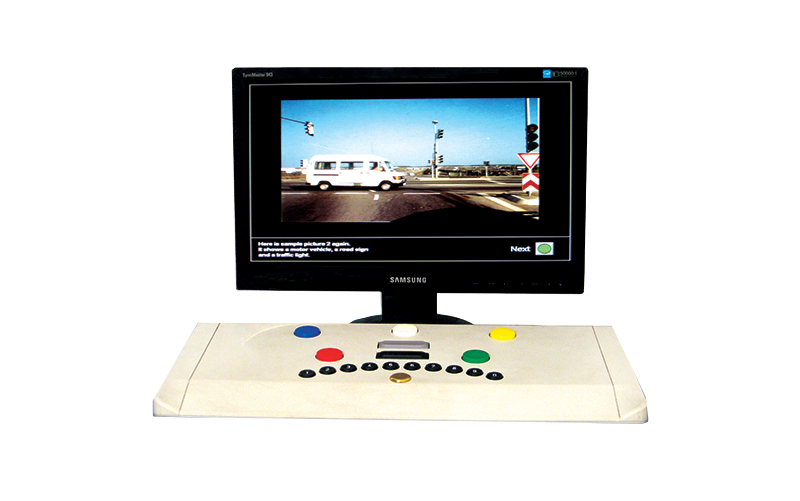
Running Tests with Vienna Test System
Read more
Automated scoring
After administration, the tests are automatically scored. Test taker results are presented as tables, charts or graphs. Test variables are displayed together with the raw scores and the corresponding norms. These norm value comparisons refer either to an overall sample or to partial samples, created according to criteria related to age, gender, education, among others. Results are displayed as raw scores, as standard scores such as T-scores and Z-scores, as well as percentile ranks. The coloured profile report format makes it possible to assess results “at one glance”, by providing a simple guide to whether results are in the low, average or above average range, in accord with the standard deviations from the mean.Participant’s reaction time, as well as the working speed per item, are shown on the test output. For some questionnaires an item analysis protocol, including all of the questions and answers given, is also available. Where answers have been omitted or where responses suggest test manipulation tendencies, hints for interpretation are issued.All results can be displayed on a monitor or printed. In addition, a multitude of options exist for customising the presentation of test results, including: choice of the comparative norm groups, the level of results detail, and optional graphs, tables and interpretative notes.